
Micrometer
Micrometer, a powerful instrumentation library, acts as a facade to numerous monitoring systems, simplifying the process of gathering and exposing application metrics. This article provides a comprehensive overview of Micrometer, covering its core concepts, key features, practical examples, and advanced use cases. Learn how to effectively leverage Micrometer for robust application monitoring and performance analysis.What is Micrometer?Micrometer is an application metrics facade designed to simplify the process of collecting and exporting metrics from Java applications. Inspired by metrics libraries like Dropwizard Metrics, Micrometer provides a unified API to instrument your code and publish metrics to various monitoring systems without being tightly coupled to a specific vendor. Think of it as SLF4J, but for metrics!Key Features of Micrometer Vendor Neutrality: Supports multiple monitoring systems like Prometheus, Datadog, New Relic, Graphite, InfluxDB, and more. Dimensional Metrics: Utilizes tagged metrics, allowing for richer and more flexible analysis. Tags provide context and enable powerful filtering and aggregation. Spring Boot Integration: Seamlessly integrates with Spring Boot, providing auto-configuration and convenient metric collection. Simple API: Easy-to-use API for instrumenting your code with minimal overhead. Comprehensive Metrics Collection: Supports counters, gauges, timers, distributions summaries, and long task timers. Extensible: Allows for custom metric types and implementations to meet specific needs.Core ConceptsMetersMeters are the fundamental building blocks of Micrometer. They represent measurable quantities in your application. Here are some common meter types: Counter: A simple counter that increments, representing things like request counts or error rates. Gauge: Represents a single numerical value that can fluctuate, such as memory usage or queue size. Timer: Measures the duration and frequency of short-running events. Useful for tracking response times or processing times. Distribution Summary: Tracks the distribution of observed values, providing insights into percentiles and averages. Suitable for measuring latency or response sizes. Long Task Timer: Measures the duration of long-running tasks, allowing you to track how long tasks are in progress.Meter RegistryThe Meter Registry is the central component that manages the collection and export of metrics. It acts as a bridge between your application and the chosen monitoring system. You create meters through the registry and configure how metrics are published.TagsTags (also known as dimensions) are key-value pairs that add context to your metrics. They allow you to slice and dice your data for more granular analysis. For example, you might use tags to differentiate metrics based on HTTP method, endpoint, or user type.Getting Started with MicrometerAdding the DependencyIf you're using Maven, add the following dependency to your pom.xml:<dependency> <groupId>io.micrometer</groupId> <artifactId>micrometer-core</artifactId></dependency>For Gradle, add this to your build.gradle:dependencies { implementation 'io.micrometer:micrometer-core'}Creating a Meter RegistryThe next step is to create a Meter Registry. The type of registry you create depends on the monitoring system you want to use. For example, to use Prometheus, you would create a PrometheusMeterRegistry:import io.micrometer.prometheus.PrometheusConfig;import io.micrometer.prometheus.PrometheusMeterRegistry;PrometheusMeterRegistry registry = new PrometheusMeterRegistry(PrometheusConfig.DEFAULT);Instrumenting Your CodeNow you can start instrumenting your code using the Meter Registry. Here's an example of creating a counter:import io.micrometer.core.instrument.Counter;Counter requestCounter = Counter .builder('requests.total') .description('Total number of requests') .tag('method', 'GET') .register(registry);requestCounter.increment();And here's an example of creating a timer:import io.micrometer.core.instrument.Timer;Timer requestTimer = Timer .builder('request.latency') .description('Request latency in milliseconds') .tag('method', 'GET') .register(registry);long startTime = System.nanoTime();try { // Your code here} finally { requestTimer.record(System.nanoTime() - startTime, TimeUnit.NANOSECONDS);}Micrometer with Spring BootMicrometer integrates seamlessly with Spring Boot, making it incredibly easy to collect and expose metrics. Spring Boot provides auto-configuration for Micrometer and several common monitoring systems.Adding DependenciesTo enable Micrometer in your Spring Boot application, add the following dependencies:<dependency> <groupId>org.springframework.boot</groupId> <artifactId>spring-boot-starter-actuator</artifactId></dependency><dependency> <groupId>io.micrometer</groupId> <artifactId>micrometer-registry-prometheus</artifactId> <scope>runtime</scope></dependency>The spring-boot-starter-actuator dependency provides the necessary infrastructure for exposing metrics, while micrometer-registry-prometheus provides the Prometheus registry implementation.ConfigurationYou can configure Micrometer through your application.properties or application.yml file. For example, to enable the Prometheus endpoint, add the following:management.endpoints.web.exposure.include=prometheusThis will expose the Prometheus endpoint at /actuator/prometheus.Automatic Metrics CollectionSpring Boot automatically collects several metrics, including: JVM metrics (memory usage, garbage collection) CPU metrics Tomcat metrics (request counts, session management) Cache metrics Data source metricsYou can customize which metrics are collected and how they are configured through your application properties.Custom Metrics in Spring BootYou can also create custom metrics in your Spring Boot application. You can inject the MeterRegistry into your components and use it to create meters as shown in the previous examples. Alternatively, you can use Spring's @Timed annotation to automatically time method execution.import io.micrometer.core.annotation.Timed;import org.springframework.stereotype.Service;@Servicepublic class MyService { @Timed(value = 'my.service.latency', description = 'Time taken to execute my service method') public void myMethod() { // Your code here }}Choosing a Monitoring SystemMicrometer supports a wide range of monitoring systems. Here are some popular options: Prometheus: A popular open-source monitoring system known for its powerful query language and alerting capabilities. Datadog: A commercial monitoring platform offering comprehensive dashboards, alerting, and integrations. New Relic: Another commercial monitoring platform with a focus on application performance monitoring (APM). Graphite: An open-source time-series database used for storing and visualizing metrics. InfluxDB: A time-series database optimized for storing and querying time-stamped data.The best choice depends on your specific needs and infrastructure. Prometheus is a great option for open-source environments, while Datadog and New Relic offer more comprehensive features and support.Advanced Use CasesCustom Metric BindingsFor more complex scenarios, you can create custom metric bindings to collect metrics from third-party libraries or custom components. This involves implementing the MeterBinder interface and registering it with the MeterRegistry.Asynchronous Metrics CollectionFor performance-critical applications, you can collect metrics asynchronously to avoid blocking the main thread. This can be achieved using a separate thread pool or reactive programming techniques.Dynamic TaggingYou can dynamically add tags to your metrics based on runtime conditions. This allows you to track metrics with more granular context and adapt to changing application behavior.Best Practices Choose meaningful metric names: Use clear and descriptive names for your metrics to make them easy to understand. Use consistent naming conventions: Establish a consistent naming convention for your metrics and tags to ensure consistency across your application. Tag your metrics effectively: Use tags to add context to your metrics and enable powerful filtering and aggregation. Monitor your metrics regularly: Set up dashboards and alerts to monitor your metrics and identify potential issues. Keep your metrics up-to-date: Ensure that your metrics are accurate and relevant to your application's current behavior. Consider security: Protect your metrics endpoint to prevent unauthorized access.ConclusionMicrometer is a versatile and powerful instrumentation library that simplifies the process of collecting and exposing metrics from Java applications. Its vendor-neutral API, dimensional metrics, and seamless Spring Boot integration make it an excellent choice for modern application monitoring. By following the best practices outlined in this article, you can effectively leverage Micrometer to gain valuable insights into your application's performance and behavior. If you are looking for reliable tools, consider exploring Wayleading Tools for your monitoring needs.References Micrometer Official Website Spring Boot Actuator Metrics Documentation
Related products
Related products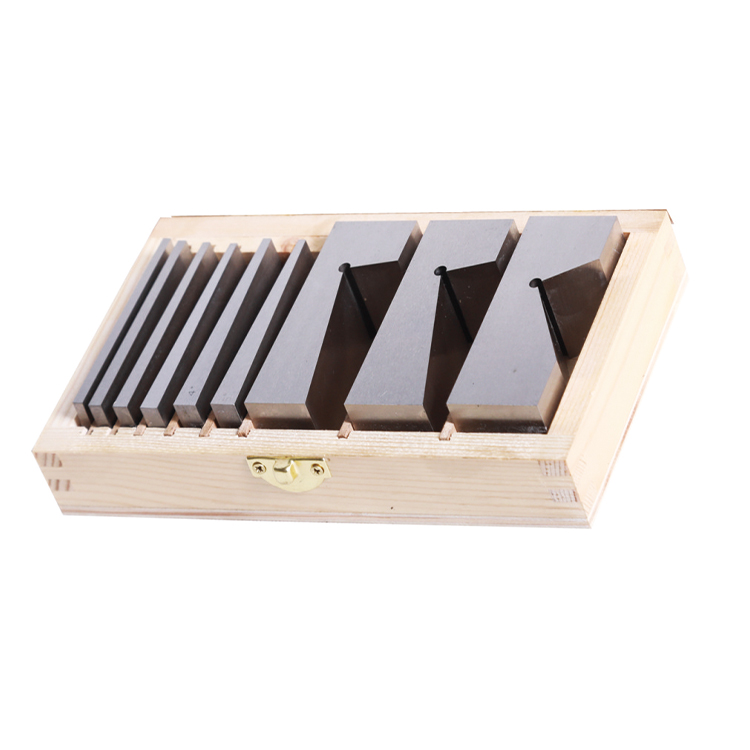
Best selling products
Best selling products-
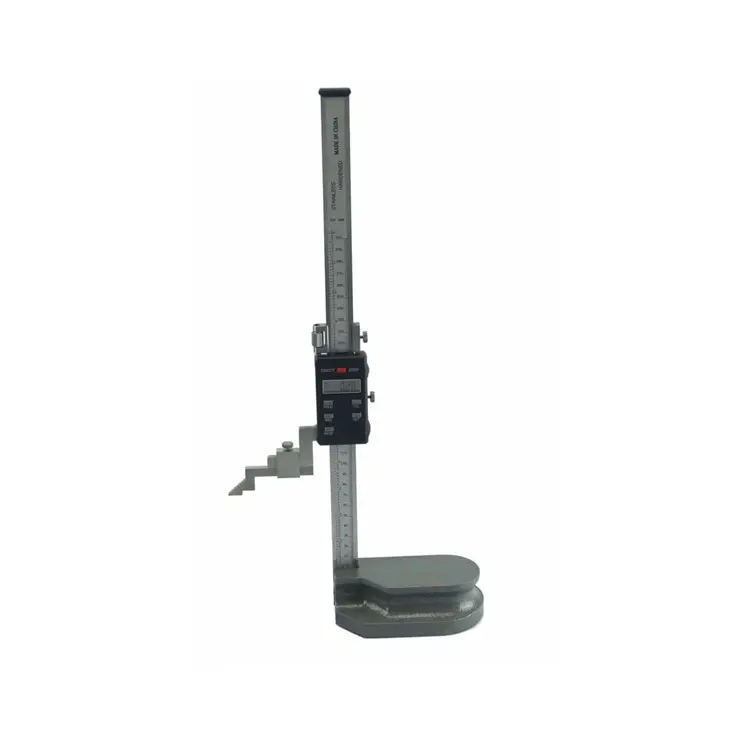 Electronic Digital Height Gauge From 300 to 2000mm
 -
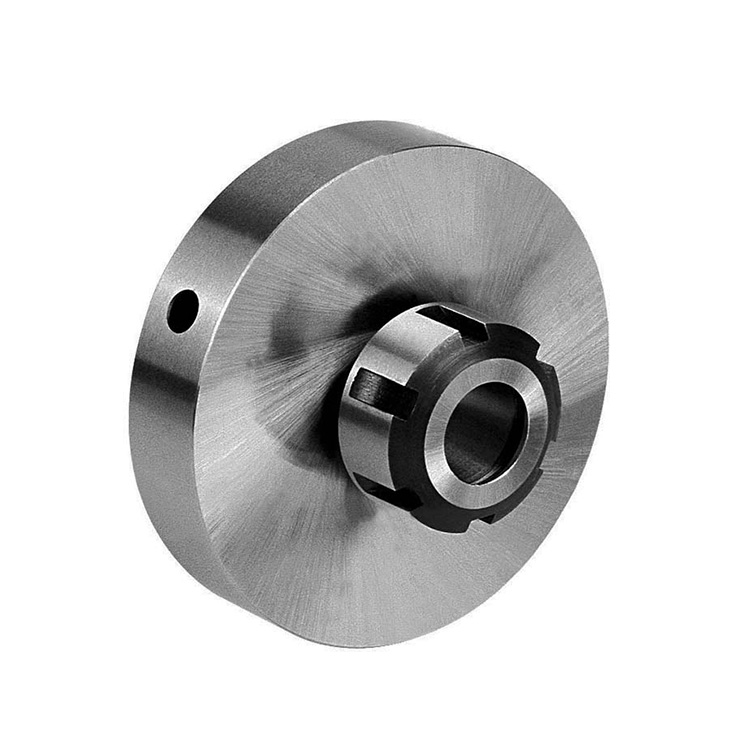 Plain Back ER Collet Fixture With Lathe Collet Chuck
 -
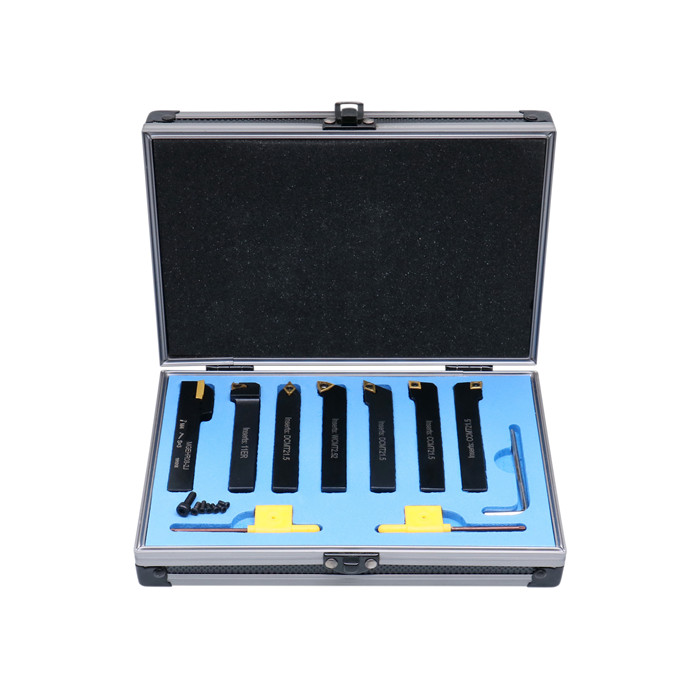
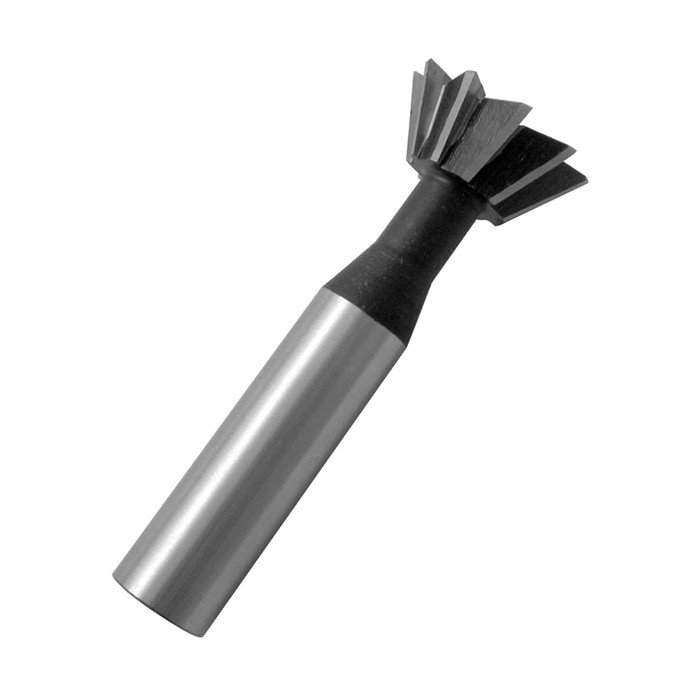 HSS Metric & Inch Dovetail End Mill With 45 And 60 Degree For Industrial
 -
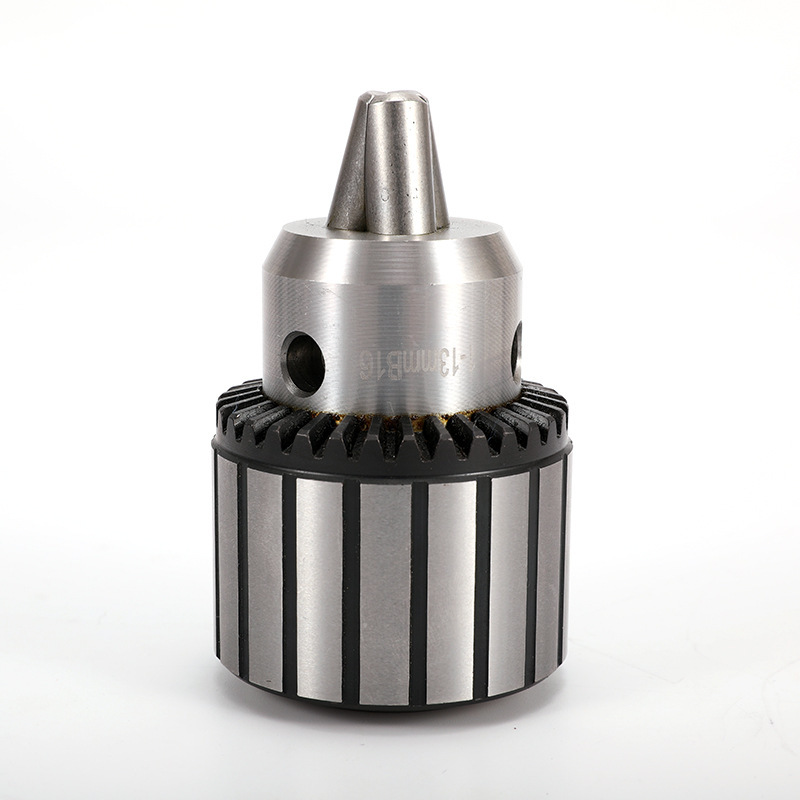
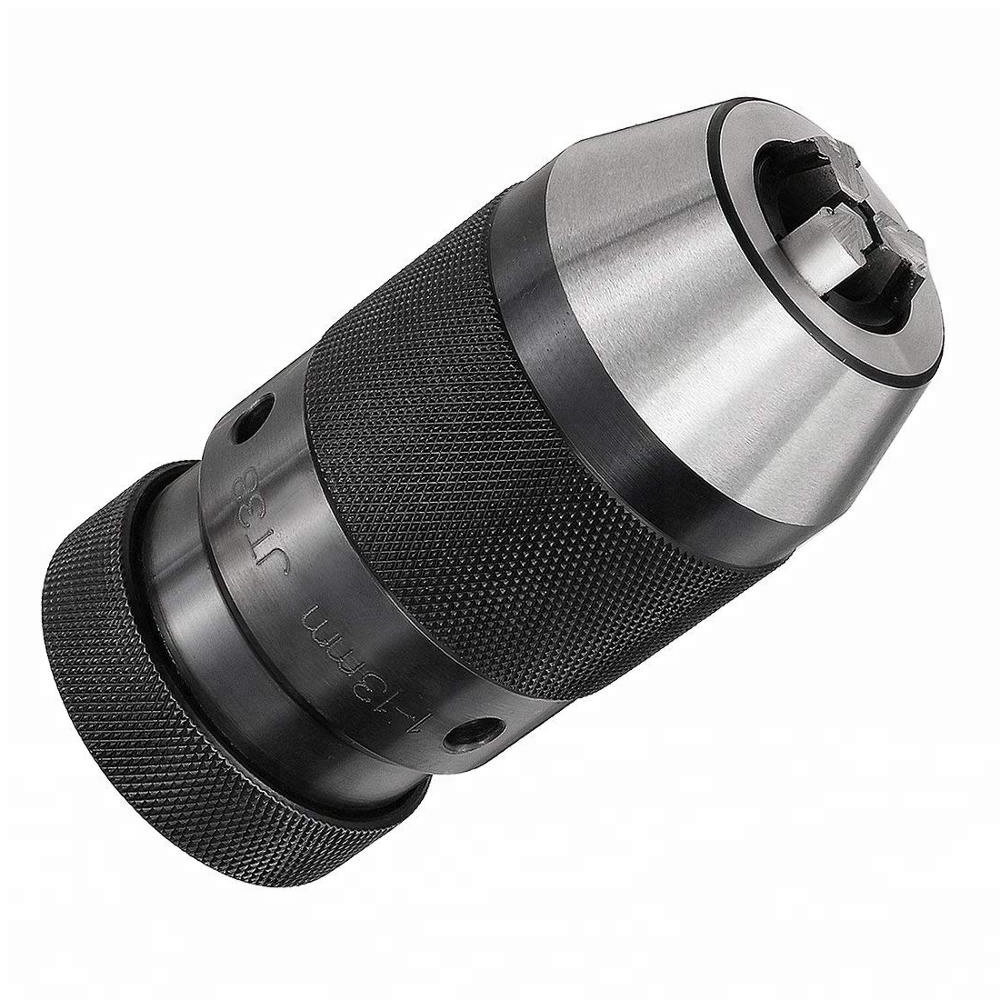 Keyless Drill Chuck With Heavy Duty Type
 -
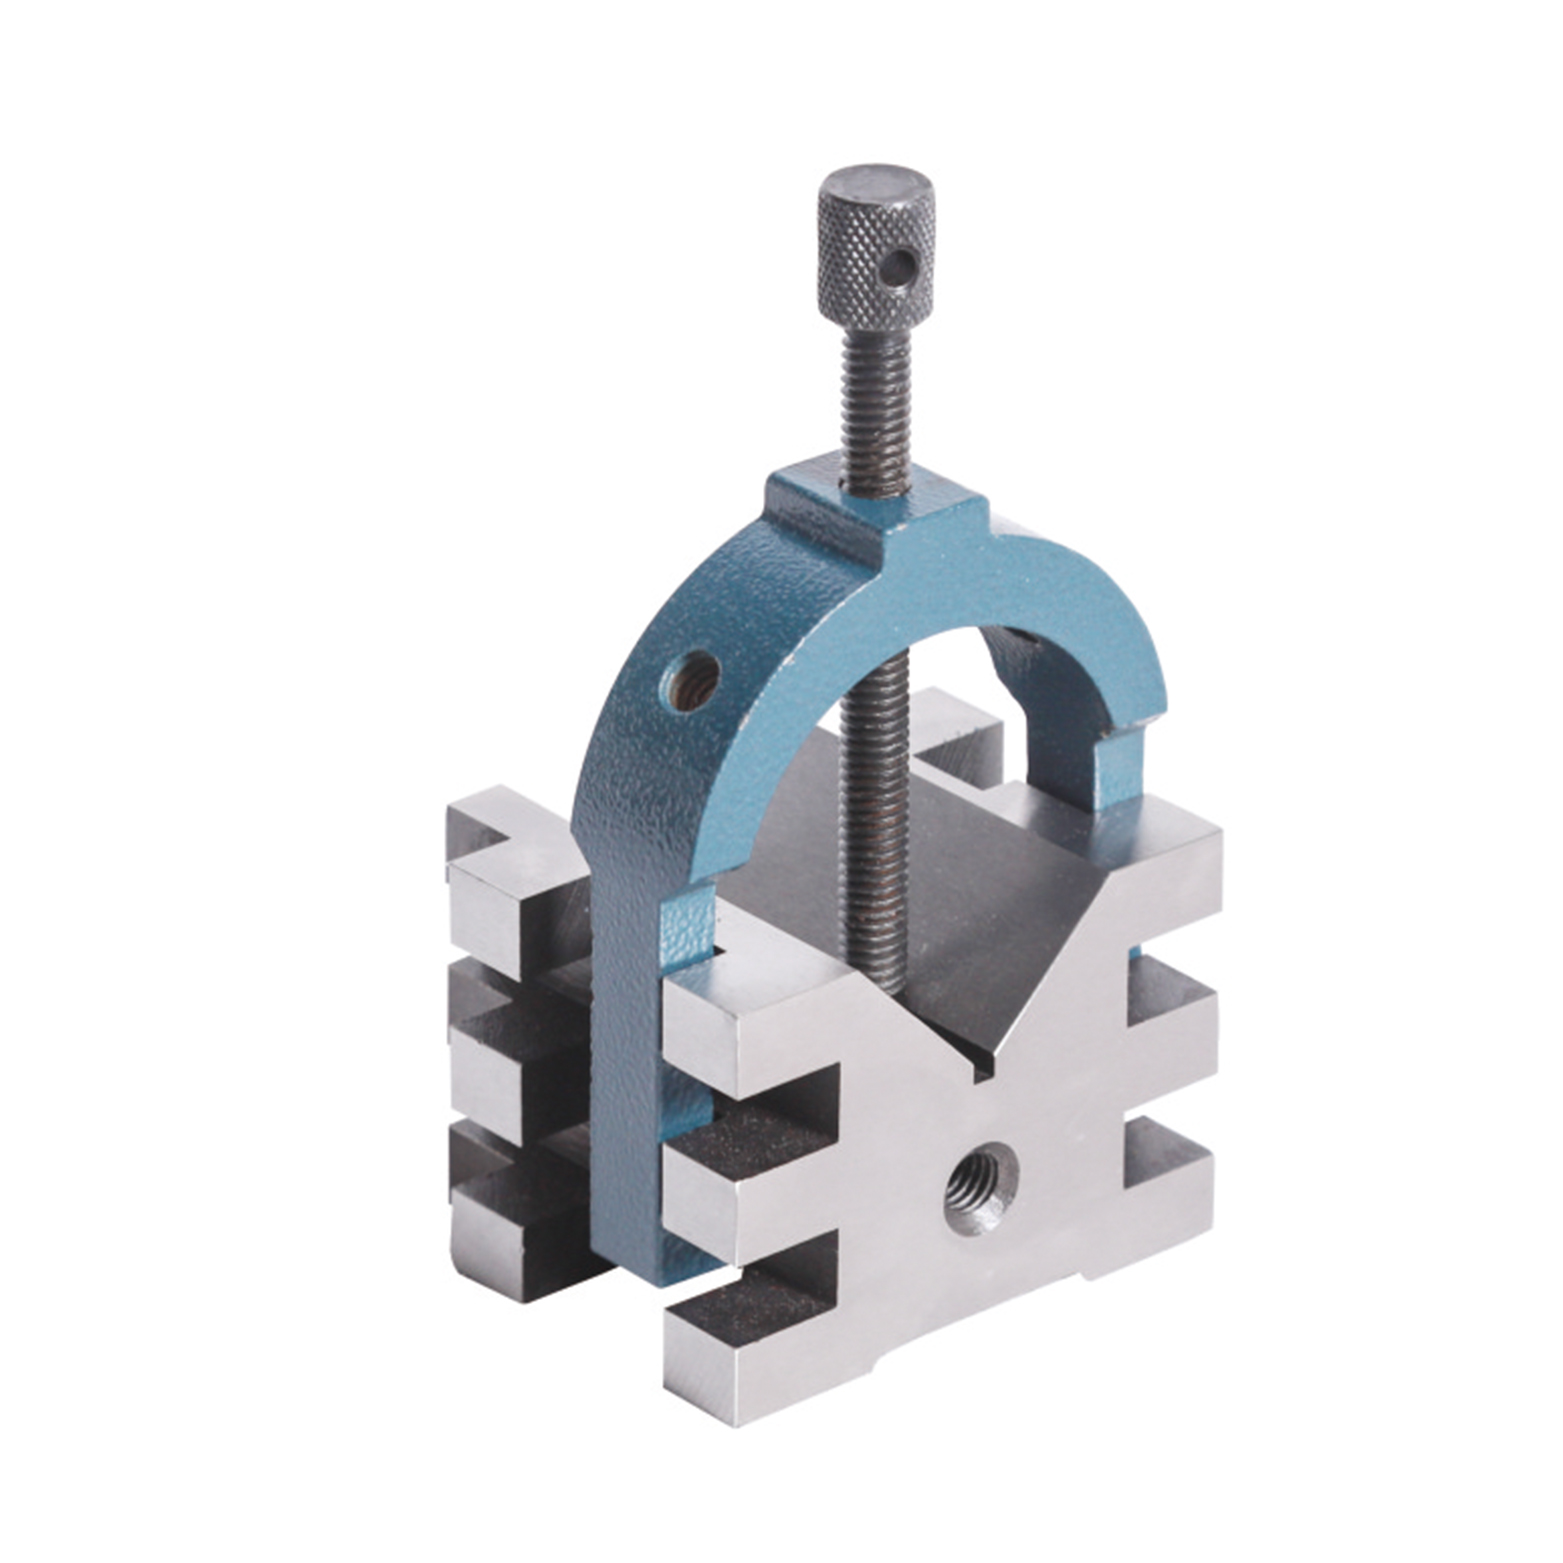 Precision V Block And Clamps Set With Heavy Duty
 -
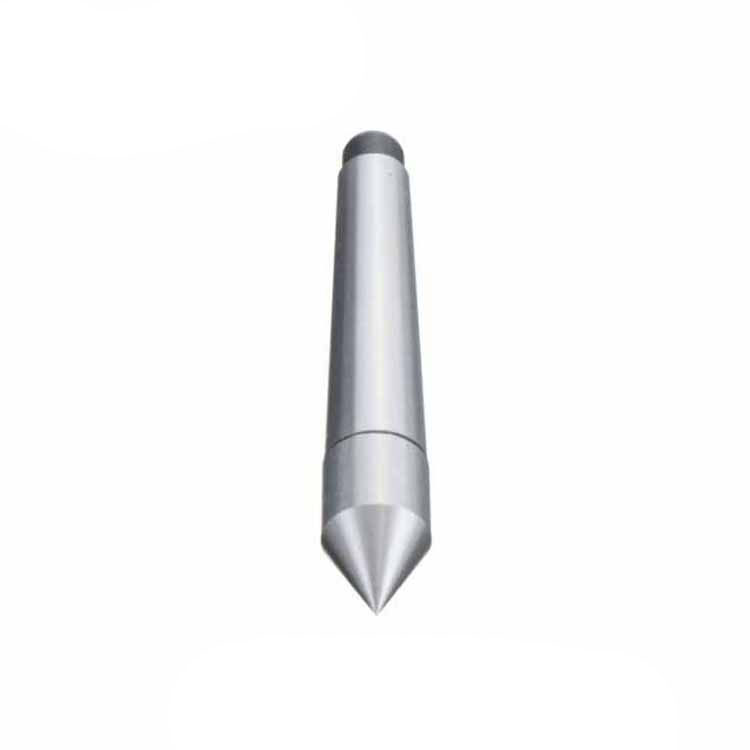
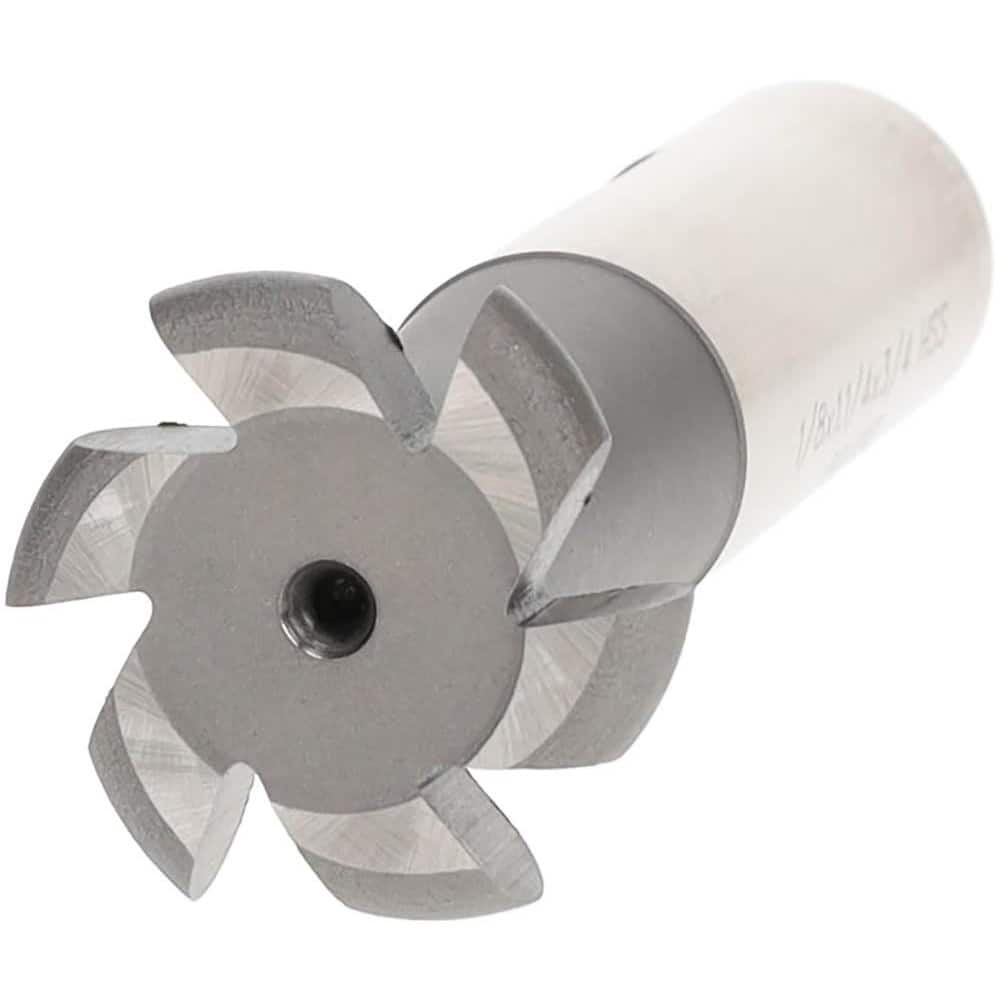 HSS Inch Convex Milling Cutter For Industrial
 -
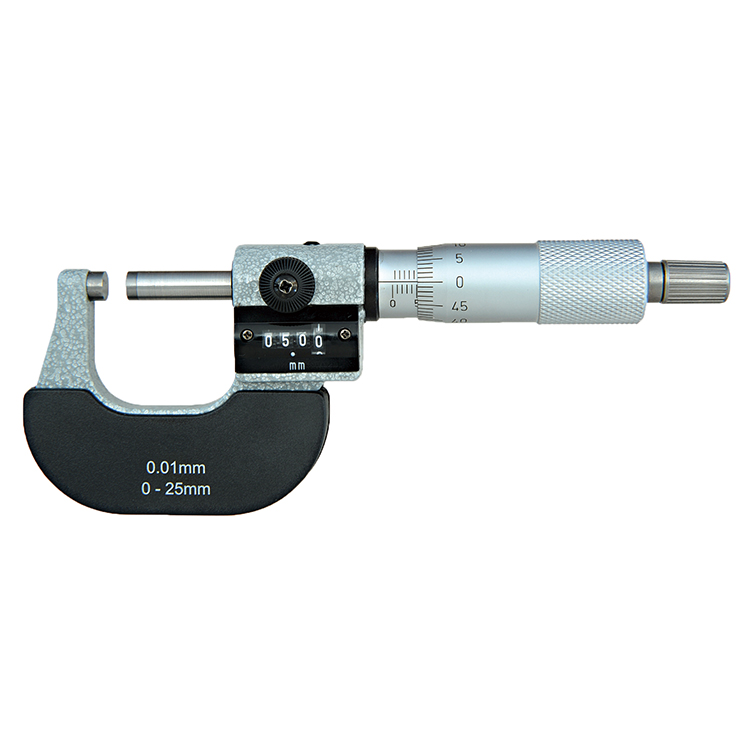
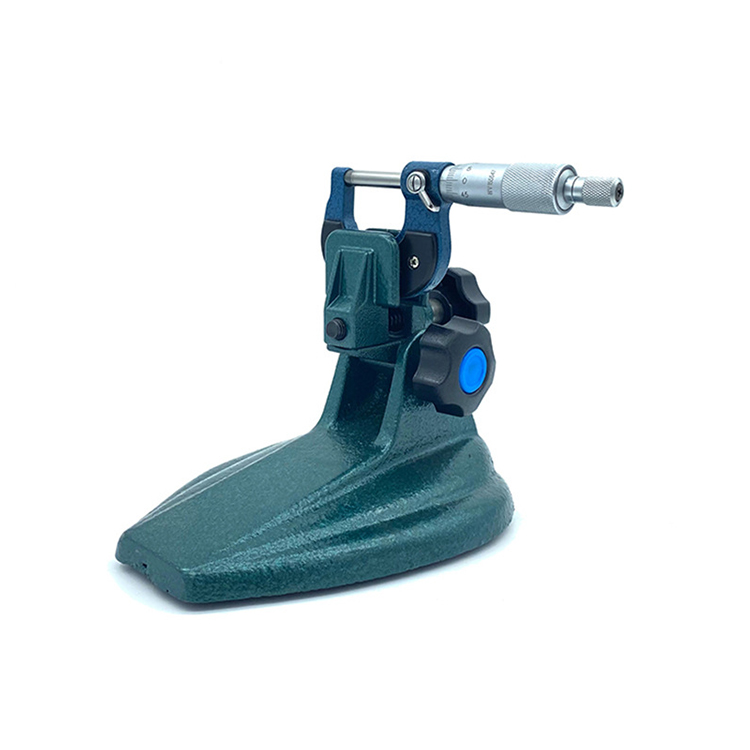 Precision Micrometr Holder For Micrometer
 -
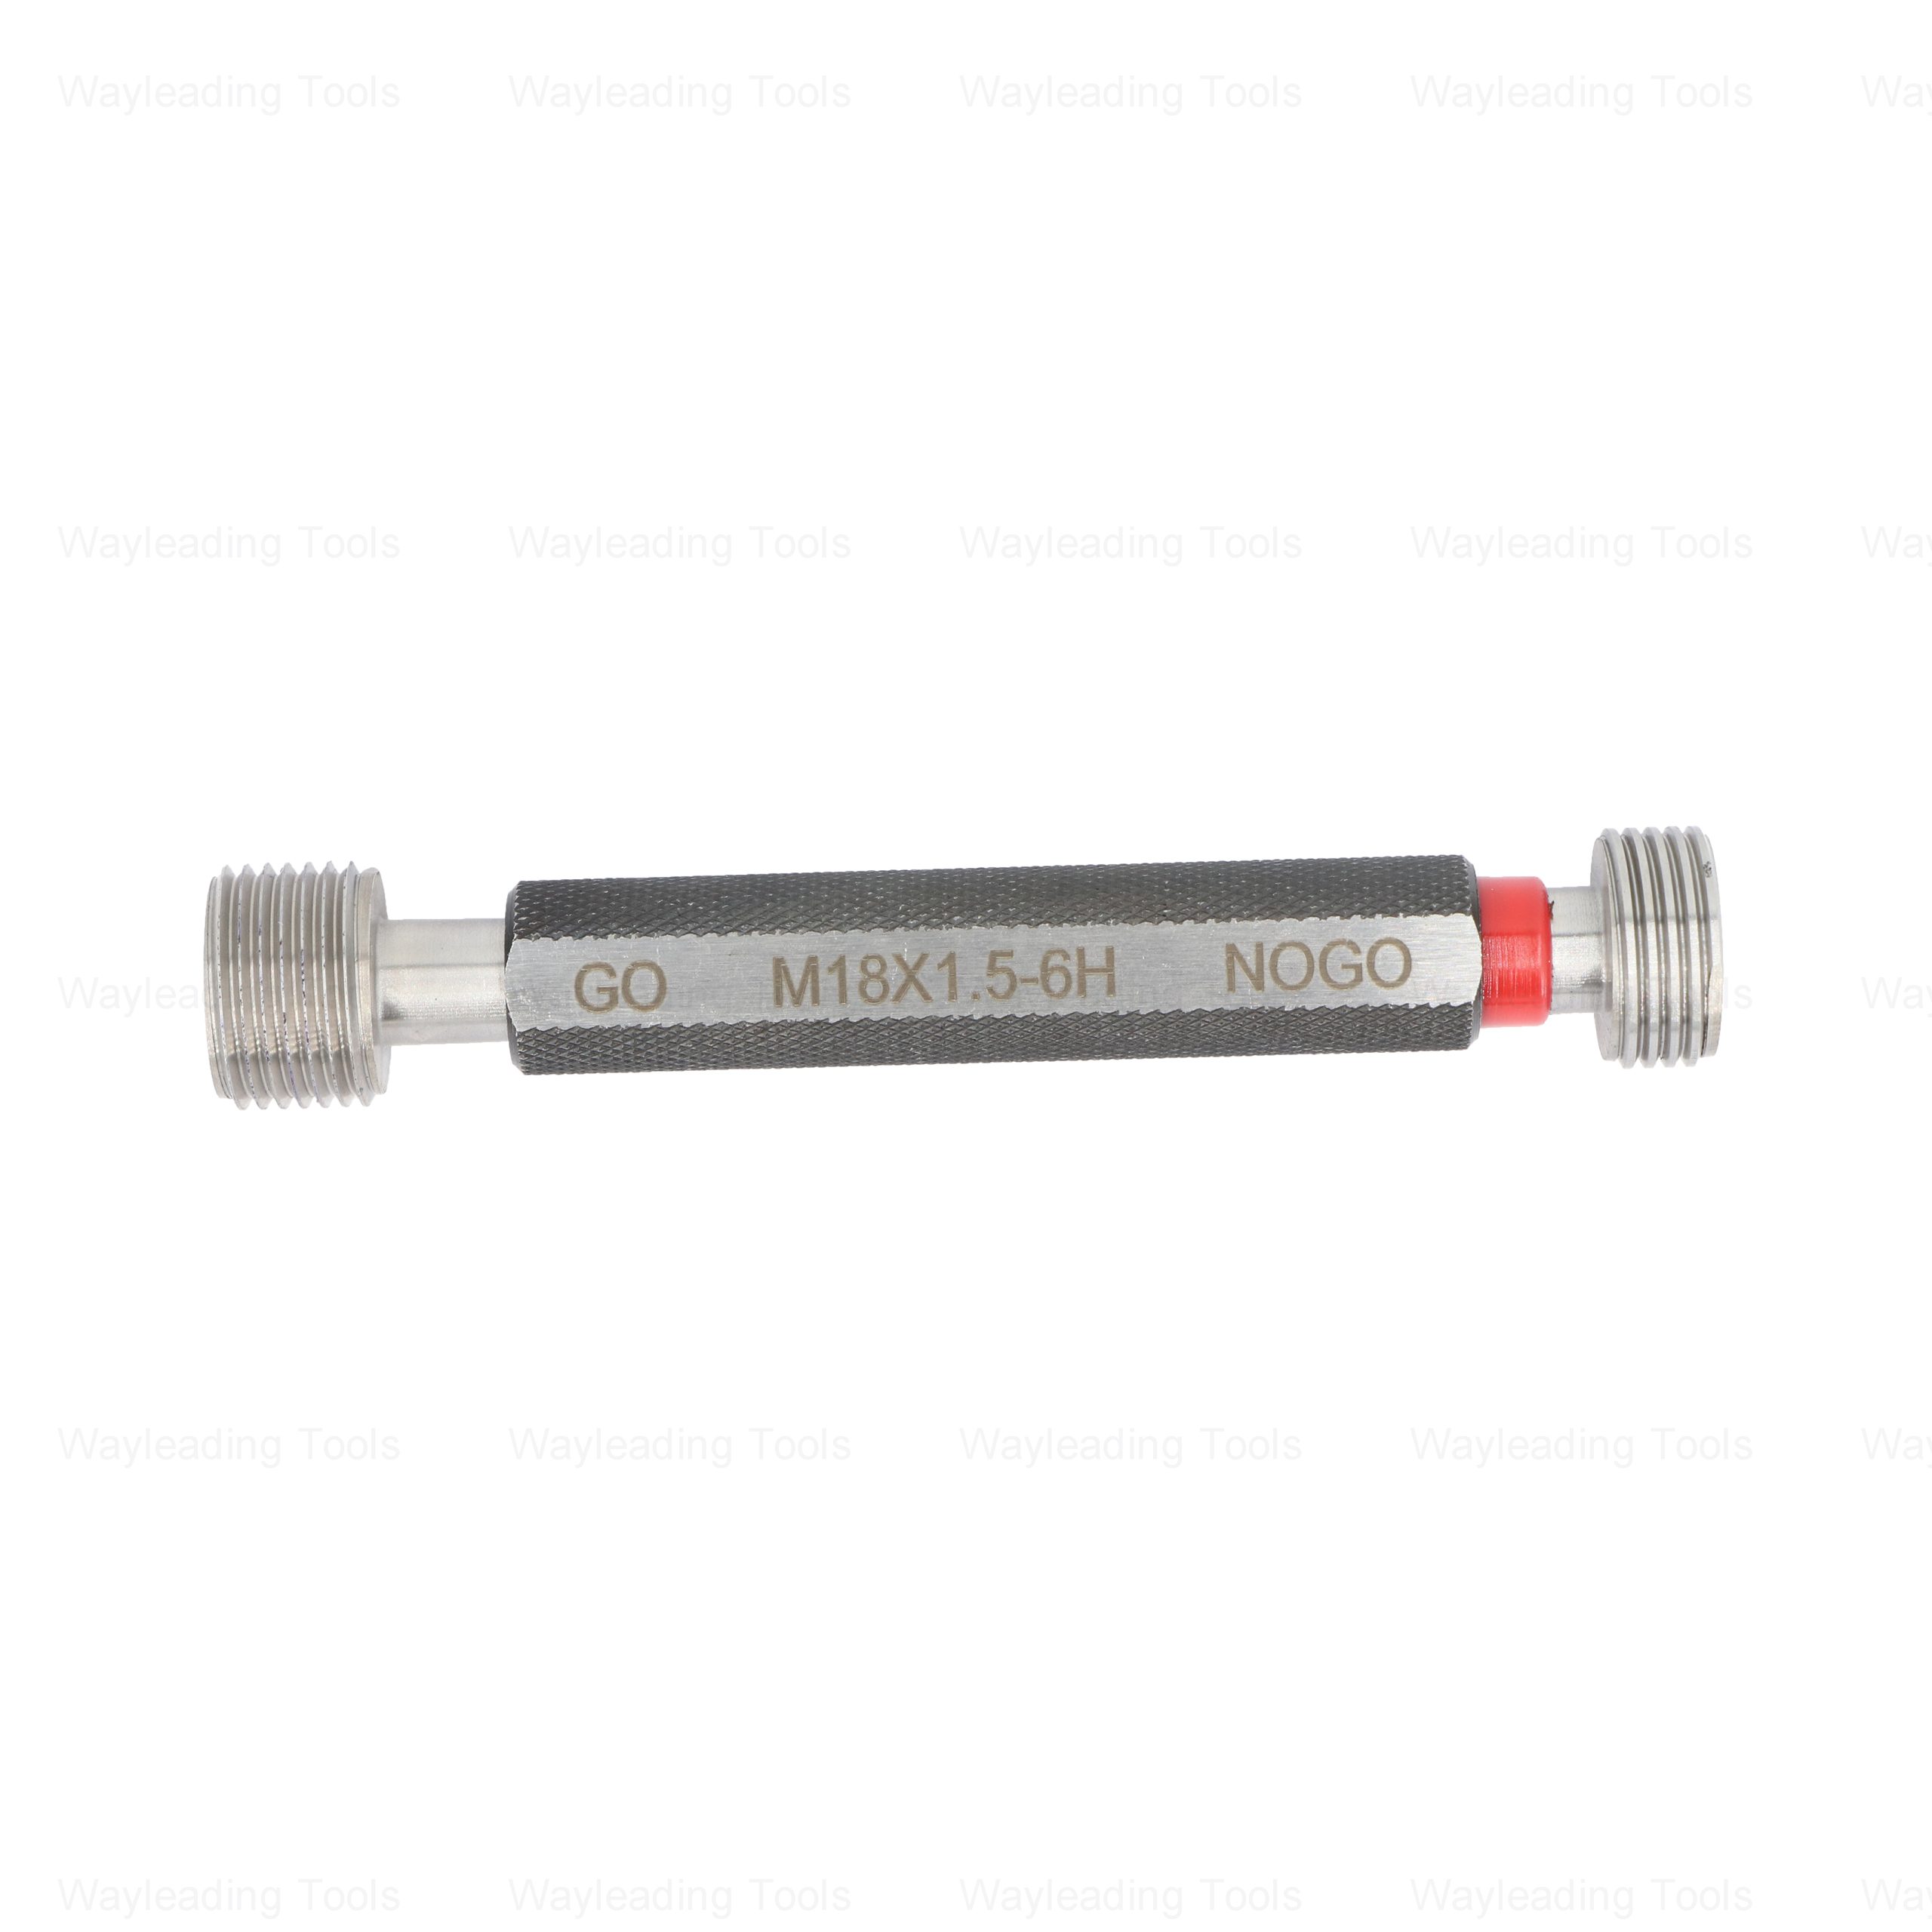 Thread Plug Gauge – Metric Size
 -
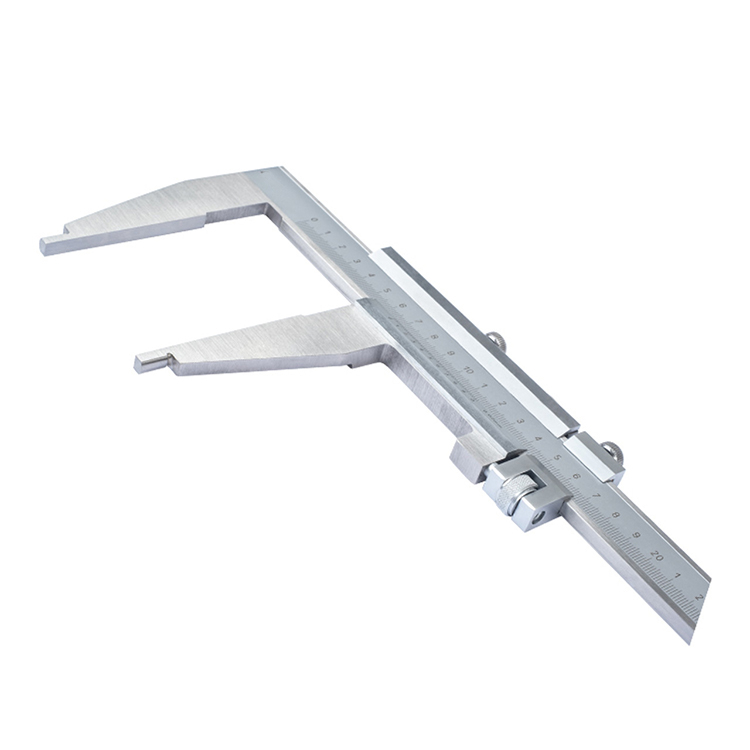
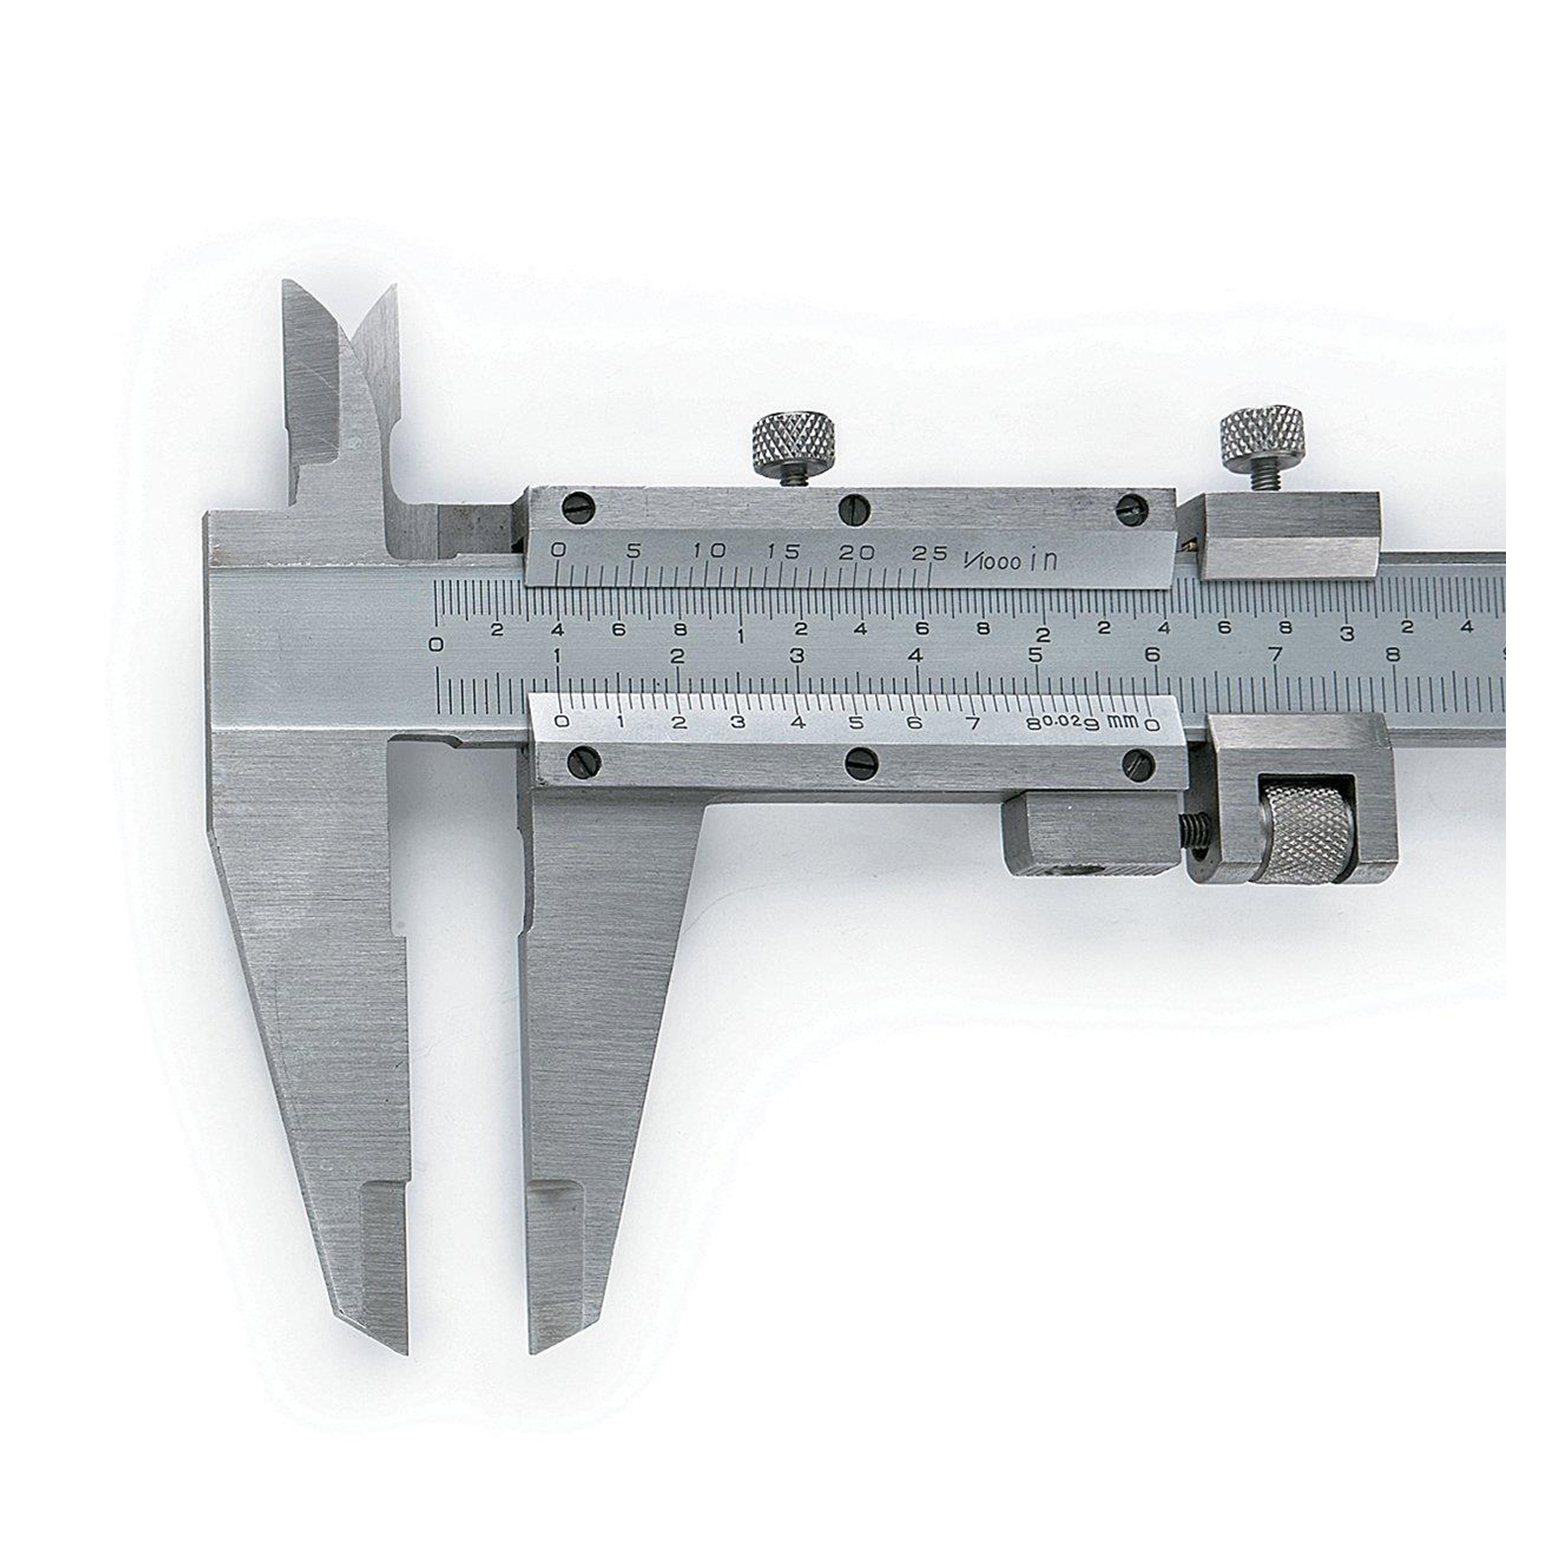 Precision Fine-Adjustment Vernier Caliper Of Metric & Imperial For Industrial
 -
 Type E Heavy Duty Deburring Tool Set With Deburring Holder And Deburring Blade
 -
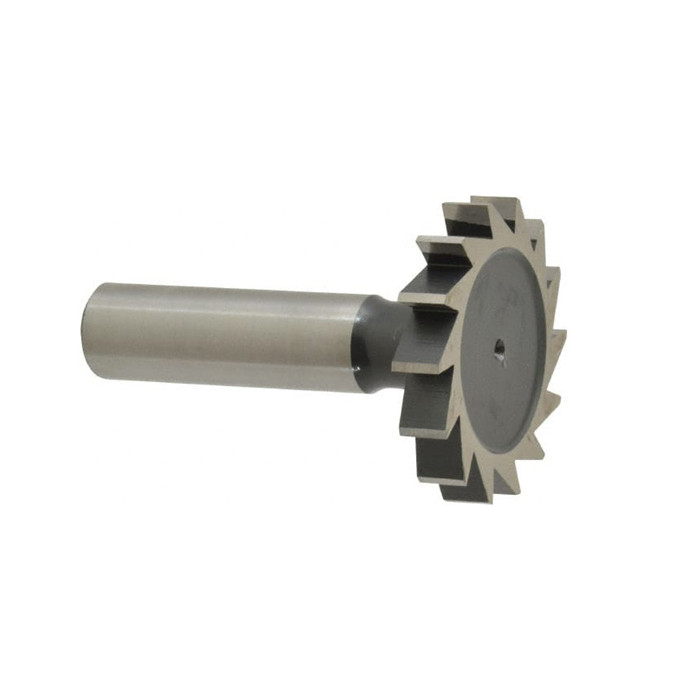 HSS Metric & Inch Woodruff Keyseat Cutter With Straight Or staggered Teeth
 -
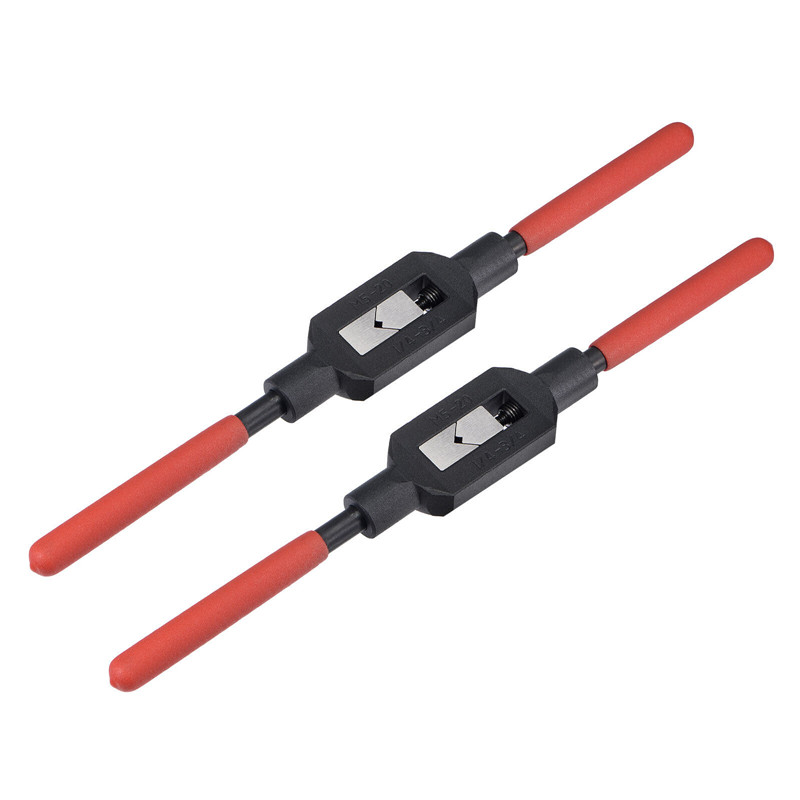 Adjustable Tap And Reamer Wrench For Thread Cutting Tools


